Reach vs. Impressions: How to Read the Numbers in SNS PR Reports
This article was automatically translated from the Japanese original. Read the original in Japanese

Sponsored collaboration reports on social media usually list several metrics side by side: reach, impressions, engagement, and engagement rate. Even though these numbers describe the same post, the impression they create can look completely different depending on which metric you're looking at. Many people have likely found themselves puzzled by situations like "impressions are high but the engagement rate is low" or "there's a big gap between reach and impressions"—unsure whether this represents a good result or signals a problem.
This article organizes what exactly the three metrics of reach, impressions, and engagement are counting, explains why gaps arise between them, and covers the assumptions you must always check when reading engagement rate. Rather than judging whether the numbers themselves are good or bad, this article focuses on how to read them.
The three metrics count different things
As a starting premise, reach, impressions, and engagement don't measure the same "size of response" from different angles—they count fundamentally different things to begin with.
| Metric | What it counts |
|---|---|
| Reach | The number of accounts that saw the post (excluding duplicates) |
| Impressions | The number of times the post appeared on screen (including duplicates) |
| Engagement | The number of reactions taken by viewers, such as likes, comments, saves, and shares |
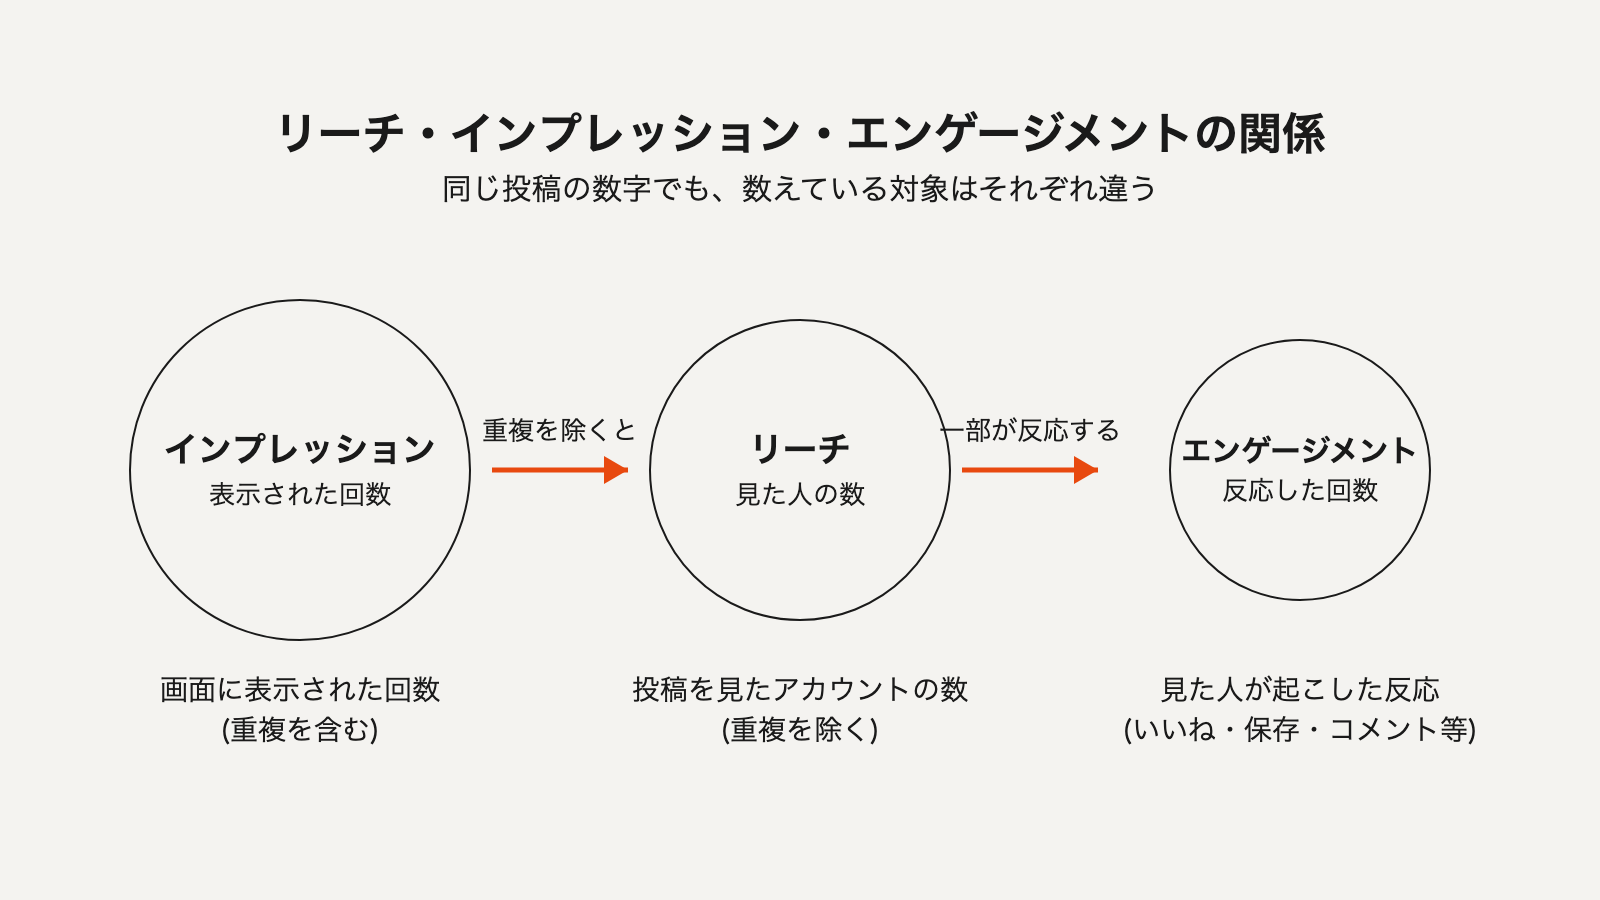
Figure 1: The relationship between reach, impressions, and engagement
Reach counts "how many people it reached," impressions count "how many times it was displayed," and engagement counts "how many reactions occurred." If the same person views the same post three times, reach stays at 1 while impressions rise to 3. If you compare two such numbers side by side without accounting for this difference, you'll misread the reasons behind their increases or decreases.
What's happening when there's a big gap between reach and impressions
Even among posts from the same account, some show a large gap between reach and impressions while others show almost none. The size of this gap isn't an indicator of whether the post is good or bad—it's an indicator of "how many times it was shown to the same people."
The main factors that widen this gap include:
- Multiple exposures in feeds or recommendation sections. While a post continues to be favored by the algorithm, it may keep appearing repeatedly on the same person's screen
- Repeated loops in Stories or Reels. Some platforms count multiple displays within a single viewing session
- Return visits triggered by saves or shares. When people revisit a saved post later, or a shared post is viewed in multiple locations, only impressions accumulate
A large gap by itself is neither good nor bad. You could even argue that a post shown repeatedly is more likely to stick in memory. What matters is not comparing reach and impressions as if they carry the same meaning. An evaluation like "impressions didn't grow as much as reach" doesn't hold up as a comparison in the first place, since the two metrics measure fundamentally different things.
Engagement rate itself changes depending on how the denominator is set
Engagement rate is the metric most commonly used for comparison in reports. However, the number itself changes depending on how the denominator is defined. Broadly speaking, the denominator is either follower count or reach count.
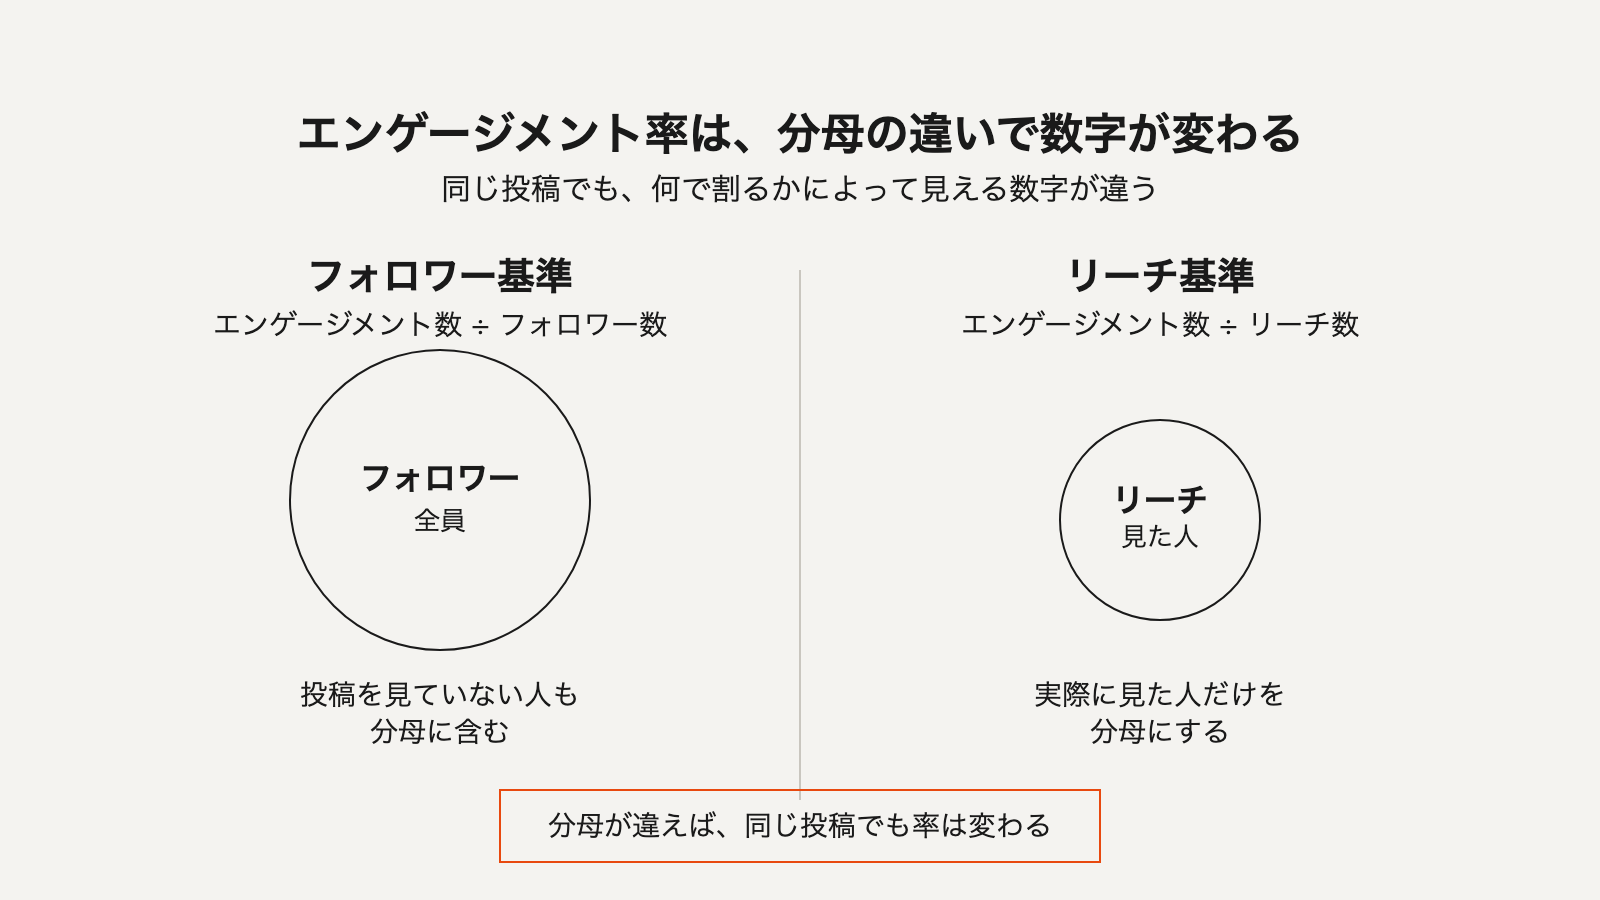
Figure 2: Differences in the denominator used for engagement rate
When follower count is used as the denominator, the calculation includes even people who never saw the post, so posts with narrow reach tend to show a lower rate. When reach count is used as the denominator, only people who actually saw the post are included, which tends to produce a higher rate than the follower-based calculation. Even for the same post, the number takes on a different appearance depending on which denominator is used.
When we sorted through our own performance records and isolated only the cases where we could confirm the denominator was follower count, it became clear that this mixing of denominators makes the numbers harder to interpret. We found cases where the variation between individual accounts within the same follower tier was actually larger than the difference between tiers themselves (for more detail, see How Much Does Engagement Rate Really Vary Within the Same Follower Tier?, an analysis based on 487 performance records). Even when comparing two accounts with similar follower counts, the comparison itself doesn't hold up unless you confirm that the engagement rate denominators were calculated on the same basis.
When you receive a report, what you should check isn't how high the rate is by itself, but whether the denominator is follower count or reach count, and whether that basis is consistent when comparing multiple posts or influencers. Ranking numbers that aren't calculated on a consistent basis leads to judgments that don't reflect reality.
Sometimes the very definition of a metric changes by platform
Everything discussed so far has assumed that the meaning of a metric is consistent regardless of platform. However, the definition of a metric itself can change due to platform-side specification updates.
As one example, YouTube changed how it counts views in August 2026. Previously, long-form videos were only counted as one view after being watched for a certain length of time, but under the new rules, a view is counted as soon as the first frame plays. This aligns the standard with how Shorts are counted. Meanwhile, the view count used to determine ad revenue and Partner Program eligibility remains under the previous standard, meaning the publicly displayed view count and the revenue-related view count now exist as two separate figures (for more detail, see News That Caught Our Casting Team's Eye This Week (Week 1, September 2026)).
When a specification change like this occurs, comparing the same term "view count" from before and after the change actually means comparing numbers calculated on different bases. Whether comparing metrics across platforms or comparing numbers over time on the same platform, it's necessary to check, each time, what standard is currently being used to count that metric.
The three metrics each answer a different question
Now that we've organized the assumptions for comparing metrics, let's step back and consider why we look at these three metrics in the first place. Reach, impressions, and engagement aren't metrics that compete for superiority—each answers a different question.
Reach answers the question of reach itself: "Did it reach the intended range?" It serves as a clue for checking whether the targeting, or the audience of the influencer engaged, overlapped with the intended demographic. Impressions answer the question of contact frequency: "How much repeated exposure did it get?" Given the tendency for repeated contact to be more memorable than a single exposure, this is useful for gauging the depth of exposure. Engagement answers the question of response to content: "How much did viewers actually react?" It reflects whether the post's angle or creative resonated with the audience it reached.
Trying to compare these three using a single yardstick creates strain. A post with wide reach but low engagement can be a signal to reconsider the fit between the audience reached and the creative; a post with narrow reach but a high engagement rate can be read as having struck a strong chord with its intended audience. Which is the "better" post depends on the objective of the campaign.
What to check when reading a report
The first thing to check when you receive a report isn't the size of individual numbers, but whether the foundation for comparison is consistent. Specifically, check the following points:
- Whether the discussion is about reach or impressions, and whether the two are being conflated
- Whether the engagement rate denominator is follower count or reach count, and whether this basis is consistent across the multiple posts or influencers being compared
- Whether a platform specification change occurred partway through the period in question, and if so, whether the numbers from before and after are being compared as if they were on the same basis
Unless these three points have been checked, an evaluation of whether a number "rose" or "fell" doesn't hold up in the first place. Conversely, once the foundation for comparison is established, reach, impressions, and engagement each become valuable clues for viewing a campaign from a different angle.
Scope of this article
This article covered the definitions of reach, impressions, and engagement, along with the assumptions you should check before comparing them. It did not, however, cover the benchmarks for what level each metric should reach to be considered "good," or general market ranges by platform or category. Since the appropriate level depends on the campaign's objective and the content of the creative, we believe this is something that should be considered on a case-by-case basis for each individual project. This article also does not go into the measurement methods themselves—the details of platform dashboard specifications or aggregation logic.
Closing thoughts
Looking only at the size of the numbers tends to reduce the discussion to whether reach or impressions grew more, or whether the engagement rate is high or low. But simply checking what each metric is actually counting, and whether the denominators used for comparison are consistent, changes the precision of the judgments you can draw from the same report. The numbers in a report only carry meaning once they're compared correctly.