Even Within the Same Follower Range, How Much Does Engagement Rate Vary? — Insights from 487 Performance Records
This article was automatically translated from the Japanese original. Read the original in Japanese

Let's start with the conclusion. Even when comparing accounts whose follower counts fall within roughly the same range, there is a substantial difference in engagement rate (ER) on their posts. This is the result of aggregating 487 records from our own performance data—records where the denominator could be standardized to follower count for comparison.
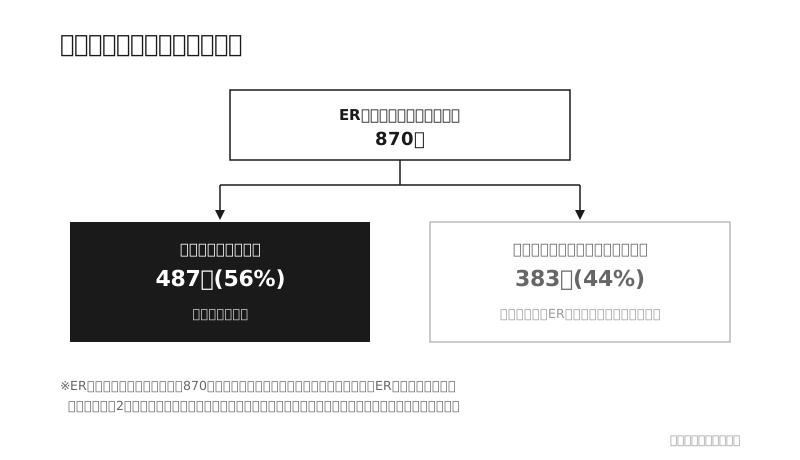
Note that all figures discussed in this article are anonymized aggregate statistics and do not point to any specific account, brand, or campaign. Of the 870 records where ER was documented, 94.5% were Instagram posts, so please read the following as findings specific to Instagram.
Why We Examined This Number
When narrowing down candidate accounts, it's common to use follower count "ranges" as a rough guide—an intuitive sense that an account with X0,000 followers should generate this level of response. But as we reviewed our day-to-day performance records, one thing kept nagging at us: how well is that intuition actually backed by the data? If you match follower count levels, does ER end up roughly aligned too? This time, we tested that question against our performance records.
What We Compared, and on What Terms
When we pulled every record with ER documented, 870 records qualified. However, checking each of these 870 records individually revealed that the "denominator" used for the ER figures was inconsistent. Some values used post-level reach or impressions as the denominator, while others used follower count—44% were reach/impression-based, and 56% were follower-based. Values using reach as the denominator tend to run higher, since the base number is smaller. If we compare these two types mixed together, we can no longer tell whether an observed difference reflects "variation by follower count" or merely "variation in how the record was measured."
So for this article, we limited our analysis to the 487 records that could be confirmed as using follower count as the denominator. All figures below represent engagement rate relative to follower count.
Results: Variation Within a Range Exceeds Variation Between Ranges
We divided follower counts into four ranges (under 30K / 30K–100K / 100K–300K / 300K and above) and calculated the interquartile range (IQR—the span containing the middle 50% of the data) for each.
| Range | n | Q1 | Q3 | IQR width within range |
|---|---|---|---|---|
| Under 30K | 48 | 2.29% | 5.09% | 2.80pt |
| 30K–100K | 135 | 1.47% | 4.39% | 2.92pt |
| 100K–300K | 192 | 0.95% | 3.47% | 2.52pt |
| 300K and above | 112 | 1.14% | 4.94% | 3.80pt |
Comparing median values across ranges, the gap between the highest and lowest range is only 1.44 points (ranging from 2.00% to 3.44%). Meanwhile, looking within each range, the spread (IQR width) among accounts belonging to the same range reaches 2.52 to 3.80 points. In other words, the individual variation within a single range is larger than the difference between ranges.
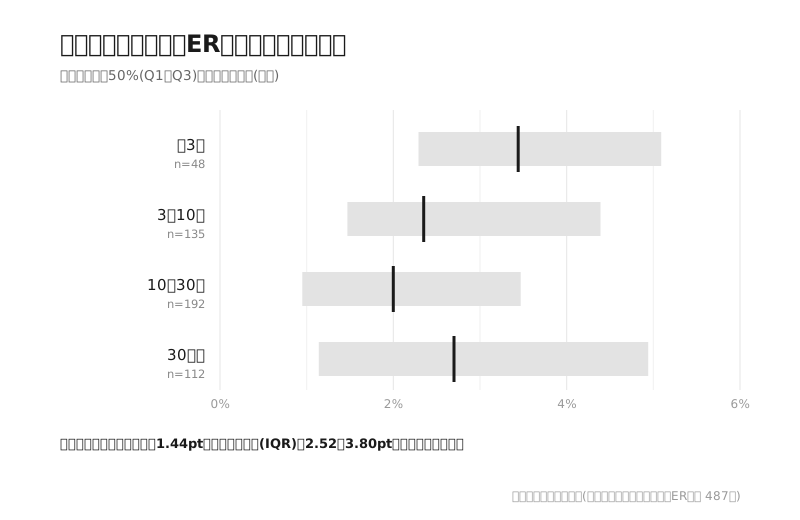
In other words, even if you match accounts on a single condition like "around 100,000 followers," the ER of the accounts within that group is still widely distributed, from high to low. Follower count level alone cannot predict how much response a given post will receive.
One Step Further: How Much Information Does a "Range" Category Actually Carry?
The idea that "follower count alone isn't enough to decide" may already be common knowledge. What we want to pause on here is what comes next.
The fact that within-range variation exceeds between-range differences suggests that talking about candidates in terms of a "follower range" category may not carry as much information as we assume. Grouping accounts as "accounts in the 30K–100K follower range" doesn't mean those accounts are similar enough in character to be treated as one uniform group.
This isn't a rejection of using follower ranges when narrowing down a candidate list. As a first-pass filter for building a long list, it works fine. But if you use range as the basis for subsequent prioritization or final selection, that judgment ends up ignoring the individual variation spread throughout that same range. Narrowing down only becomes meaningful once you look past the range and examine the individual performance records behind it.
Distinguishing When to Use Ranges
Given these results, follower range information needs to be assigned a different role depending on the stage at which it's used.
- Building the long list: As a rough first-pass filter to narrow the target scope based on the scale of a given campaign, this remains effective.
- Prioritizing candidates: Rather than relying on range level alone, you need to insert a step where you check individual performance records—how much response an account has actually generated within that same range. We cover the list-building process that precedes this individual-record review in Casting Success Is Largely Decided at the List-Building Stage.
- Aligning expectations when making proposals: Assuming a blanket rule of thumb like "this range means this level of response" risks diverging from reality once you account for the variation within that same range. We cover how to combine metrics to align expectations in KPI Design for Influencer Campaigns — How to Combine Reach, Engagement, and Branded Search.
A follower range can function as an entry point for gathering candidates, but on its own it can't serve as the basis for explaining why you chose one particular account. We also cover how to read the ER metric itself in Why High Engagement Rate Doesn't Always Translate into Results.
The Scope of This Data
There are several caveats to this analysis. The data comes from our own performance records and is not a sample representative of the industry as a whole. Records without documented ER (or where ER was noted but not readable as a numerical value) are not included in this aggregation. Additionally, of the 870 records where ER was documented, we also excluded records judged to use reach or impressions as the denominator, in order to keep the yardstick consistent. The absence of a record simply means it wasn't retained operationally—it does not imply that the ER was low. Furthermore, the follower counts used here reflect values at the time of record-keeping, which may not match the follower count at the time the post was published. Since accounts grow over time, we note this as a caveat that could affect the precision of the figures.
Closing Thoughts
Follower count level can serve as one rough benchmark for narrowing down candidates. But on its own, it cannot predict how much response a post will generate. We believe the next step is to recognize how much spread exists within a single range, and to look at individual performance records accordingly.
We plan to continue sharing insights based on our performance records going forward.
Follow-up reports will be delivered via our email newsletter. You can sign up below.
Source: Research by STATS INC. (performance records from proprietary campaigns). Aggregated from records where engagement rate was documented and could be confirmed as using follower count as the denominator. All records have been statistically processed so that no specific campaign, brand, or time period can be identified.